
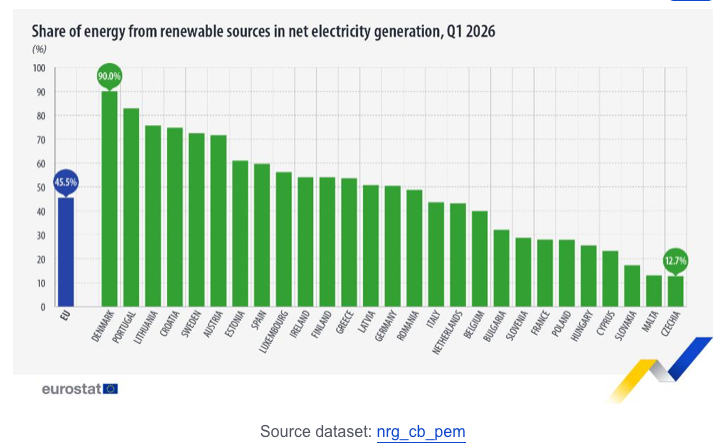
In the first quarter of 2026, 45.5% of the electricity generated in the EU came from renewable energy sources. This represents an increase from the same quarter of 2025, when the share was 42.7%.
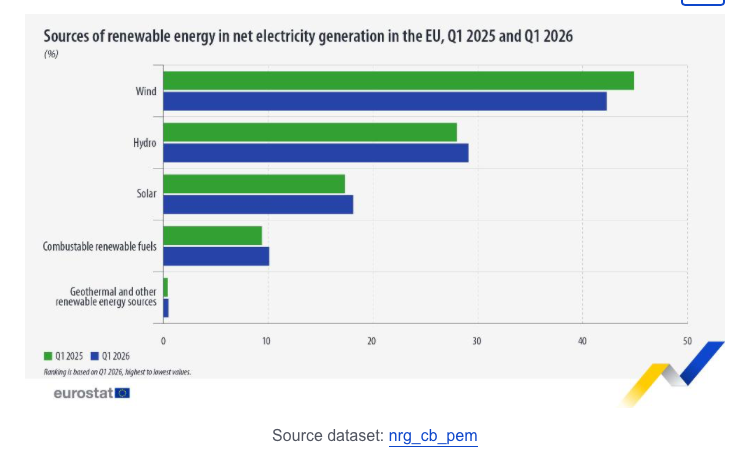
Wind was the primary source of renewable electricity in the EU, accounting for 44.9% of the total renewable electricity, against 42.3% in the first quarter of 2025. Hydro power came in second with 28.0%, followed by solar with 17.3%. The remaining renewable electricity came from combustible renewable fuels (9.4%) and geothermal and other energy sources (0.4%).
Denmark, Portugal and Lithuania take the lead
Among EU countries, the highest shares of electricity from renewable sources were generated in Denmark (90.0%, mostly wind), Portugal (82.9%, mostly hydro) and Lithuania (75.7%, mostly wind).
In contrast, the lowest shares were recorded in Czechia (12.7%), Malta (13.0%) and Slovakia (17.2%).
External link


There is a problem with these stats. As the Commission page notes: the
data is about elec production (not consumption). Not mentioned is the
amount of RES production that is constrained. Taking Spain as one
example, in 2025, about 15TWh of PV & wind never made it onto the
busbars, it was constrained off because a) RES production >>> demand &
b) Spanish network not able to move the constrained elec somewhere else
c)total failure to build storage systems – batts don’t cut it,
electrolysers do. 2026, will be worse. Observation: the TSOs tend NOT to
make constraint data easily available. ENTSO-E hides behind the excuse
that the TSOs don’t send it the data and the TSO find ways to hide
system constraint data. In answer to the obvious question: “well if you
are so clever Mike – how do you know what the constraint is” – well
that’s for me to know and I’m happy for others to work it out – if they
can. Needless to say, I have a VERY robust way to determine constraint.