
Between 2010 and 2018, total waste generation increased by 5% (114 million tonnes) in the EU-27 according to the European Environment Agency (EEA). When major mineral wastes are excluded from the total, it increased by 7% (50.3 million tonnes). This means that the EU-27 is not on track to meet its policy goal of reducing waste generation. These trends have been driven mainly by economic growth; however, the amount of waste generated increased by a smaller extent than the economy, indicating the relative decoupling of waste generation from economic growth.
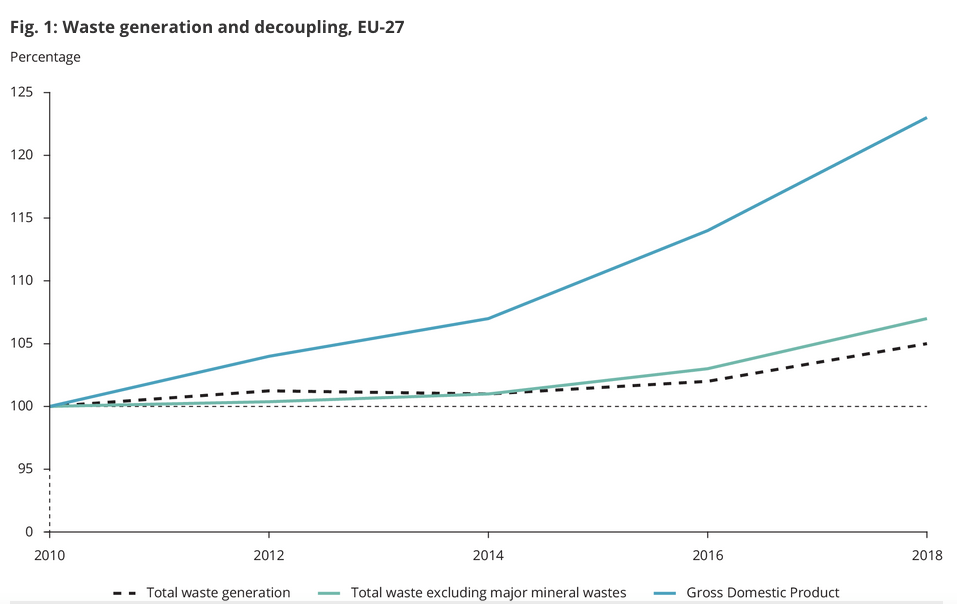
Note: This figure shows indexed values of waste production, population and gross domestic product (GDP) with the year 2010 as a reference year (2010=100%). The production phase shows generation of total waste and waste excluding major mineral wastes in absolute terms. GDP was chosen as a basic indicator of economic growth as it expresses the total value of goods and services produced in the country (the components of GDP include personal consumption expenditure plus business investment plus government spending plus (exports minus imports)). Population, expressed as average population, is an important demographic indicator, which provides insights into development in a number of possible consumers and waste producers.
Data source:
-
GDP and main components (output, expenditure and income) provided by Statistical Office of the European Union (Eurostat)
-
Waste generation and treatment (env_wasgen) provided by Statistical Office of the European Union (Eurostat)
-
Population change – Demographic balance and crude rates at national level (demo_gind) provided by Statistical Office of the European Union (Eurostat)
Waste generation is increasing in the EU. Reducing this, and achieving the absolute decoupling of waste generation from economic growth, is a primary objective of EU waste and circular economy policies (EC, 2011, 2018 and 2020). The EU Waste Framework Directive (EU, 2018) sets out a waste hierarchy, the guiding principle of EU and national waste policies.
From 2010 to 2018, total waste generation increased by 5.0% (114 million tonnes) in the 27 EU Member States (EU-27). Major mineral wastes, such as hard rocks, concrete, soils and others (that are mainly produced in the mining and construction sectors) feature in big quantities in relation to other waste types. This alters the interpretation of trends. They also usually represent an environmental issue of relatively less concern. If we exclude them from the totals, the remaining waste streams, more environmentally significant, increased even more, by 7.0% (50.3 million tonnes).
The main driver of increasing waste generation is economic growth, with gross domestic product (GDP), the most commonly used indicator of economic growth, increasing by 23% between 2010 and 2018. Population size was relatively stable and thus does not explain the trend. However, while the amount of waste generated grew considerably, it did so at a significantly slower pace than the economy, indicating the relative decoupling of waste generation from economic growth.
Changes in waste management also contributed to the trend, as nearly half of the increase can be accounted for by secondary wastes, i.e. from operations such as sorting residues. This suggests that waste management is improving in the EU but that changes in management practices that generate secondary wastes also need to be managed.
Unfortunately, the trends observed suggest that the EU is not on track to meet its goal of reducing waste generation. The trends also indicate that the EU, as a whole, is not yet fully implementing the first step of the waste hierarchy — waste prevention — as laid down in the Waste Framework Directive (EU, 2018). However, measuring waste prevention is a complex task, with data quality and quantification issues. For this reason, waste generation related to demographics (e.g. population) or economic activity (e.g. GDP) and total waste generation are considered the best indicators for quantifying waste prevention.

Note: The figure shows waste generation, excluding major mineral wastes, per capita by European country. Data presented in form of a bar chart are displayed as a comparison of the reference year (2010) and the last available year.
Data source:
-
Waste generation and treatment (env_wasgen) provided by Statistical Office of the European Union (Eurostat)
On average, 1.8 tonnes of total waste (excluding major mineral wastes) were generated per European citizen, up from 1.7 tonnes/capita in 2010. This average masks large country differences, both in absolute waste volumes per capita and in the waste generation trend.
Amounts generated ranged from less than 1 tonne per capita to 9.7 tonnes per capita in 2018. The large quantity of waste generated in Estonia is related to energy production based on oil shale (Eurostat, 2019a), while waste data for North Macedonia show a high degree of fluctuation over time. These differences partly reflect differences in the structures of countries’ economies, and extreme values or significant differences can be explained by specific situations in individual countries.
Trends over time also show a mixed picture: total waste (excluding major mineral wastes) generated per capita increased between 2010 and 2018 in 18 countries and decreased in 15 countries. In some cases, trends have been influenced by improvements in data quality over time.
External link
